JCOM Automation, Profibus, Streamline Process Management, Training
Add to Your Knowledge Base: Harnessing PROFIBUS DP Waveforms for Expert Problem Solving
Looking at the PROFIBUS DP Waveform and signal levels are key to determining if there is a problem and identifying that problem.
In the last update of both our PROFIBUS Troubleshooting and Maintenance course and our Certified PROFIBUS Network Engineering course, JCOM Automation Inc took the information on what these problems look like and consolidated it into one presentation. Before, the information was spread out over the entire course. This blog posting is based on that updated presentation.
How to tell if you have a good network?
The first thing we look at is the Oscilloscope reading of the B signal minus the A signal (aka B-A Diff). This is the RS-485 differential signal. We are looking for a square wave, with a resting voltage of 1 volt and peaks between 3 and 4 volts and -3 and -4 volts as shown below. The overshoots and undershoots that are shown here are normal at the higher baud rates.

On this screen, you can also look at the A and B signals separately by changing the Mode drop down menu:

This view will show you things that the B-A view does not. For example, although the view shown above is the waveform of a good signal, there are signs of a little bit of noise. The same level of noise is induced on to A as on to B. Therefore, we do not see this in B-A.
In this view we are looking for two symmetrical waveforms.
The last screen that we can look at to see what is happening is the Bar graph of the signal levels. For the bar graph there are two options, AB differential voltage (average) or AB differential stable voltage. The precise definition of these two options is shown below.

I always use AB differential stable voltage because it is the worse case scenario. If this value is good, then you know your network is good.
Below is an example of a good signal level as shown in a bar graph format.

The red line is at 2.5 V., you definitely want to be above that. Ideally, you want to be a volt or more above 2.5V. The other thing that I look for is how much the signal is varying. The minimum and maximum values are shown by the dotted lines. On this graph, the dotted lines are very close to the top of the signal which shows that these signals are not varying too much. Small variations are good. Large variations are bad.
The most common problems that we see with PROFIBUS are (click links to jump to a problem):
– Missing termination
– Too many terminations
– Short circuit between A and B
– Short circuit between B and shield (or A and shield)
– A&B crossed
– Two devices at the same address
– Electrical noise / EMC issues
– Water
Missing termination
PROFIBUS DP needs to have a termination at the two extreme ends of the segment. A termination here refers to a resistor network consisting of three resistors, one across A and B and one pull-up and one pull-down resistor. A segment is defined as a continuous electrical signal (no repeaters or media converters). The segment is daisy chained (no spur lines). The terminations absorb the electrical signal so that reflections do not occur.
If one termination is missing and you are looking at the signal from the node with the missing termination, then the waveform will look normal. However, the waveform of the signal from the node at the opposite end of the segment is going to look wild, like this:
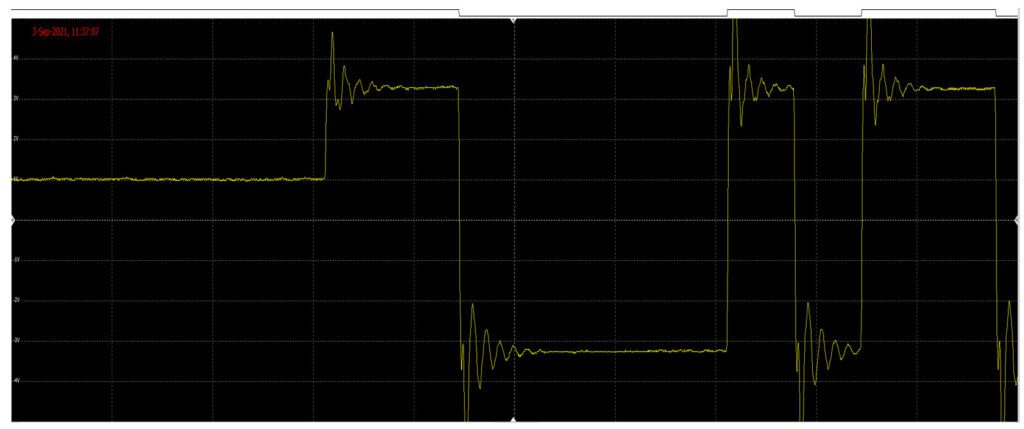
The signal levels are going to show low signal levels with large variations.

Extra Termination
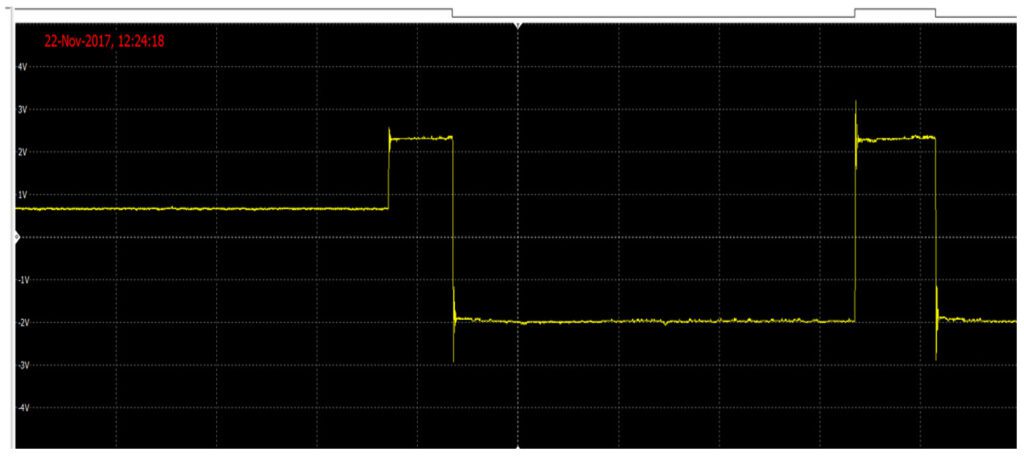
When you turn on the termination switch on a PROFIBUS DP connector, the incoming line is terminated and the outgoing line is cut off. This makes it hard to have more than two terminations. However, there are two ways that this can happen:
- Many customers use piggy-back connectors on devices to have a spot for connecting temporary diagnostic equipment. This is recommended. However, what is not recommended is using this piggy-back connector to extend the network by plugging another connector into it. This also makes it possible to have more than two terminations.
- Some devices have dip-switches on board for setup and some have the ability to turn on termination via these dip-switches.
In either case, the extra termination will lower the overall signal level.
Short Circuit between A and B
If there is a complete short circuit between A and B, then the network will be completely dead – no signal. However, most of the time, there is only a partial short. The signal will then look different at different points on the network. At the short, you will get major signal loss and possibly some ringing like this:
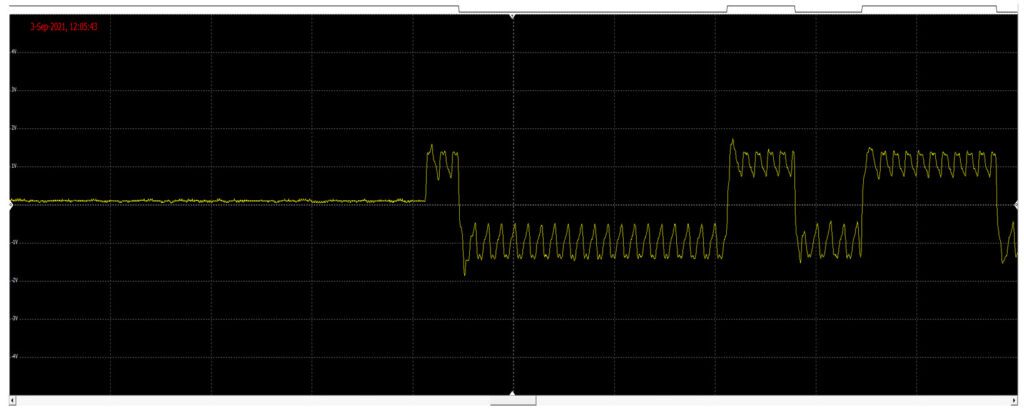
Further down the segment, you get large reverse ‘J’ reflection.
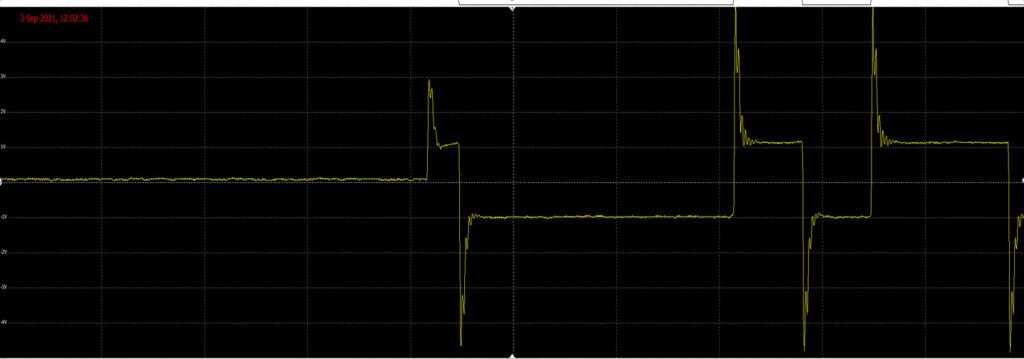
As we will see later, this is similar to an A or B short to ground. However, in this case, if you look at A and B separately, you will see both signals are symmetrical.
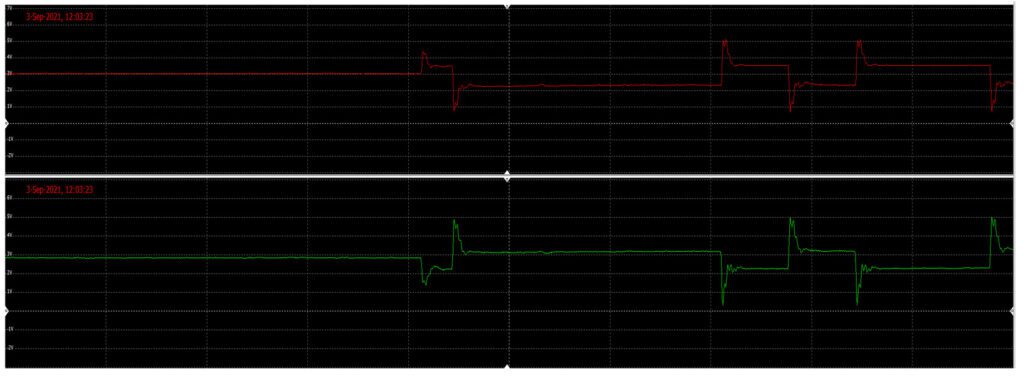
The bar graph will show signal loss and bounce. In the bar graph below, the short is at address 3.

Short between B and shield (or A and shield)
Again, this would be a partial short. The waveform looks a lot like the short between A and B except that it is a more pronounced reverse ‘J’.
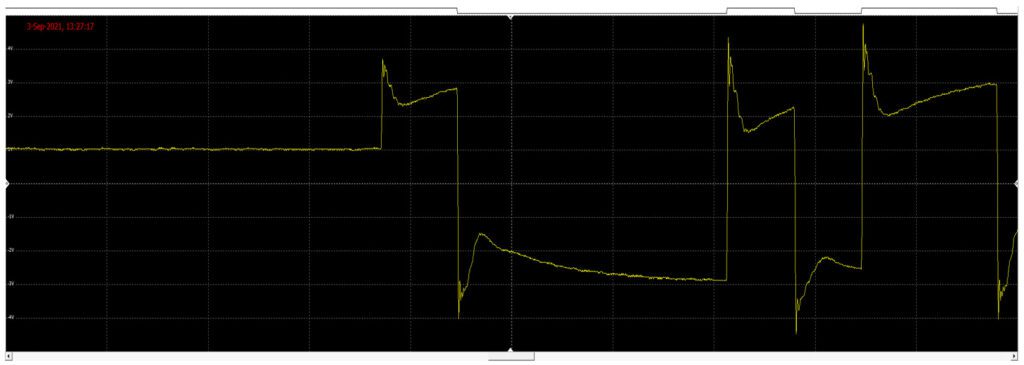
The big difference between the A to B short and B to ground short is that when you look at A and B separately, you see that there is no symmetry.
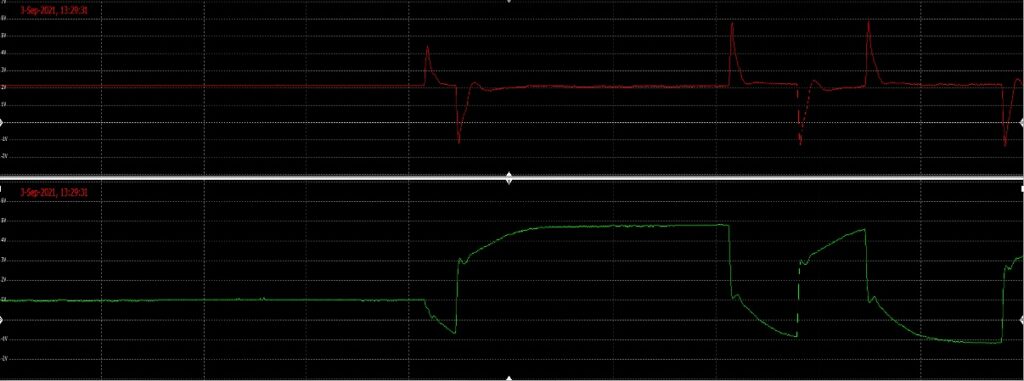
The signal loss will not be as strong as the A to B short but it will still show the large variations.

A and B crossed
On a small segment, this error will wipeout the signal completely.
On a long segment, this error will cut off the down stream devices and mess up the waveforms. I have seen this error in the field, but I do not have waveforms pictures to show.
Two devices at the same address
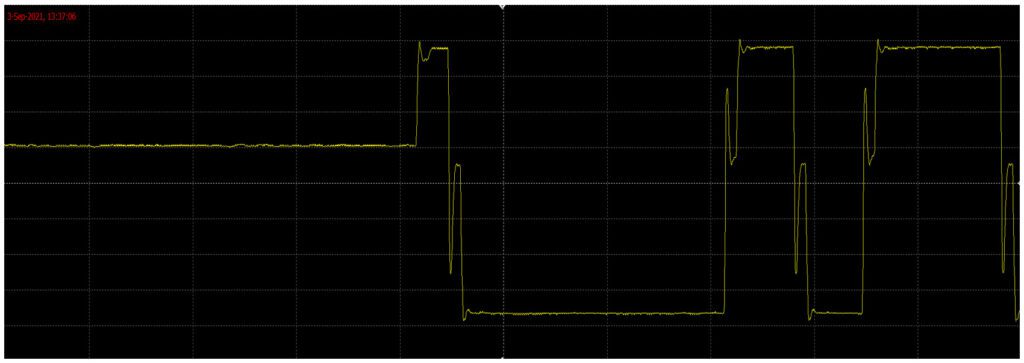
PROFIBUS is a master slave protocol. The slaves only speak on the bus when spoken too. If you have two devices at the same address when the master asks for one, it will get two replies. However, no two devices can respond at exactly the same time, so one will start and the other will crash into the first. Both messages will be destroyed.
You can tell this has happened when two devices drop off the network. However, one of them will have a signal level that is very high. In this example, 4 and 5 have dropped off the network. However, we have a signal level for 5 and it is very high.

Then when we look at the waveform for 5, it will look like two devices are talking:
Electrical Noise, EMC Issues
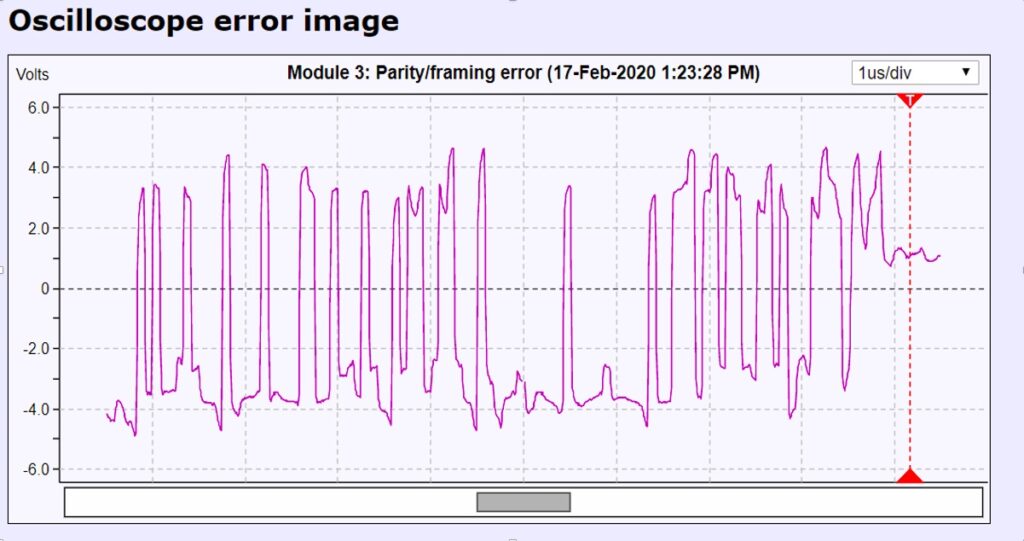
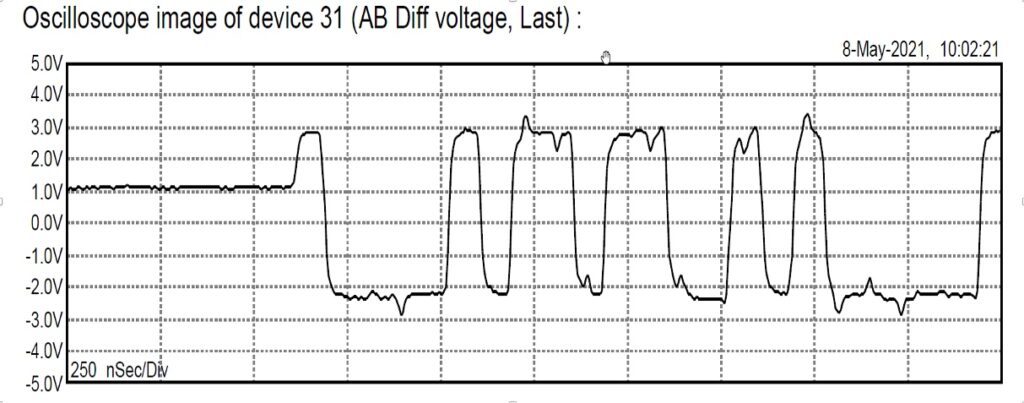
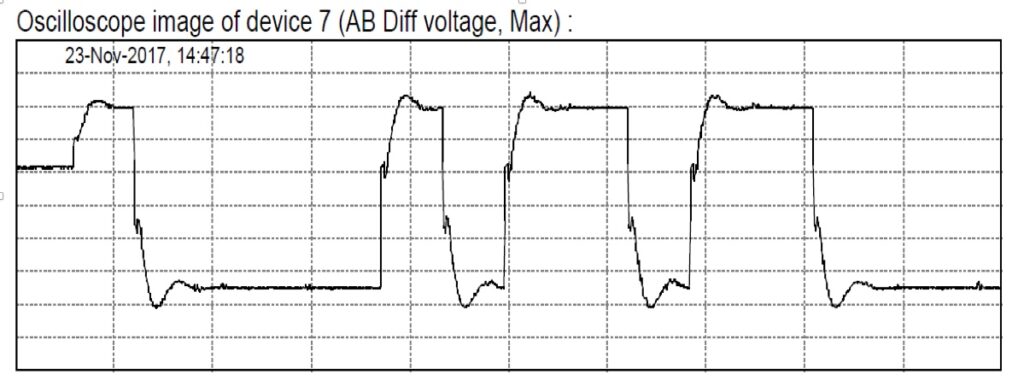
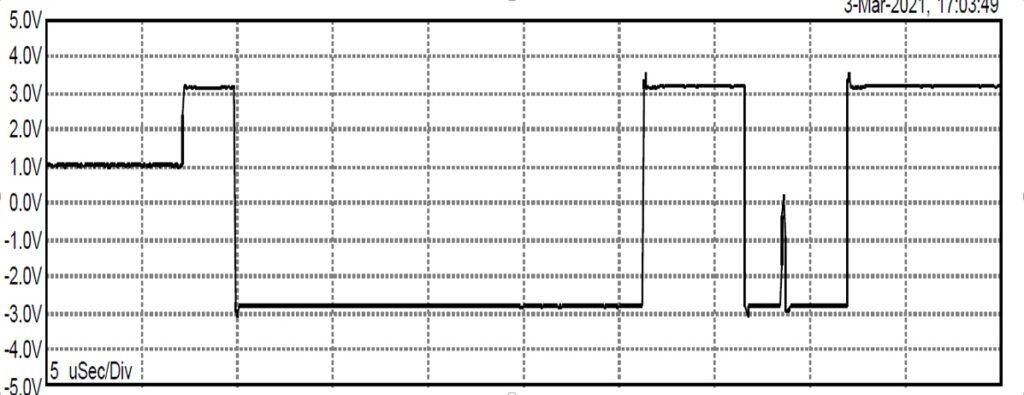
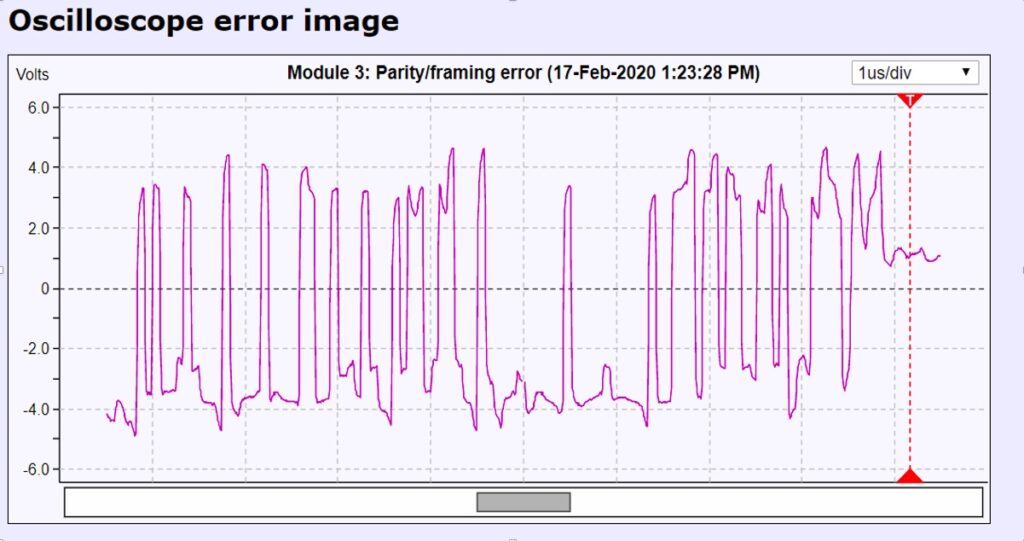
Compatibility issues (Electrical noise) are a big topic on their own. One of the hard parts in determining if there are EMC issues is that EMC issues manifest themselves differently depending on the frequency of the electrical noise.
Below are examples of EMC issues and how they affect the waveform:
Water
Water and electrical noise look the same on the waveforms. You have the same sort of jagged peaks.
If water gets into a device or connector, typically it will have no effect on the waveform at first. It is only after rust forms that you get into problems.
The best way to tell the difference between water and EMC is by measuring the shield currents.
There are so many different issues that can affect your network. We have looked briefly at some of the more common issues and how they can affect the PROFIBUS DP waveform and signal.


